Master Multiple Time Frame Analysis With This Simple Method
How can we define the market trend on multiple time frames, so we can better identify trend changes and ensure we are following the drive of market forces? Today I’ll describe my proprietary Market Trend Model to define the short-term, medium-term, and long-term trends, and share what it’s telling us about market conditions in February 2025.
Using Moving Averages to Define the Trend
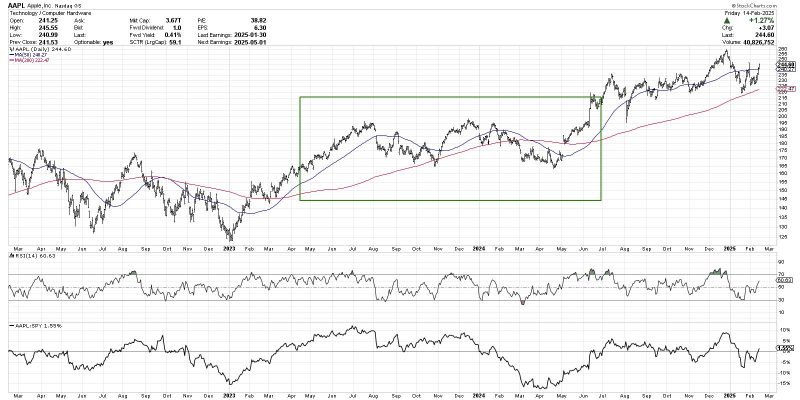
Using a simple daily chart with the 50-day and 200-day moving averages, we can show why the slope of the moving average can provide valuable insights on trend direction. Let’s look at the daily chart of Apple (AAPL), and we’ll focus on a highlighted period in 2023-2024.
Starting with the 200-day moving average, we can see that the 200-day tends to slope higher during uptrends and lower during downtrends. So for the highlighted period in 2023 and 2024, the 200-day moving average tended to slope higher through that entire trend.
Note how there were a couple meaningful pullbacks in the price of AAPL in Q3 2023 and Q2 2024. While the 200-day moving average was still sloping higher, the 50-day moving average sloped downward in each of those pullbacks. So by using two moving averages of varying periods, we can define the trend by simply looking at the slope of the moving averages.
We can also use a crossover technique and look for golden crosses (short-term moving average crosses above long-term moving average) and death crosses (short-term moving average crosses below long-term moving average) as a way of determining changes in those trends.
Exponential Moving Averages Improve Trend Detection
The problem with simple moving averages, as used above, is that they weigh all the data points equally in the calculation. So what happened two days ago has the same impact as what happened 192 days ago! By using exponential moving averages, which weight the most recent data the most, our charts will react more quickly to changes in the trend.
My Market Trend Model uses a series of exponential moving averages on a weekly chart of the S&P 500 to define the secular (long-term), cyclical (medium-term), and tactical (short-term) time frames. By using the PPO indicator, I can chart the trends using a histogram and simply check if the comparison is above or below the zero line.
Based on my model, the long-term trend has been bullish since March 2023. The medium-term trend, which is the most important one for my own portfolio analysis, turned bullish in November 2023. And the short-term trend just turned bullish in early January after flipping bearish in early December of last year.
Tracking the Market Trend Model in February 2025
When my Market Trend Model is bullish on all three time frames, as it is as of this Friday’s closing price data, it tells me to be looking for long ideas and make sure I am taking on risk in my portfolio. If the short-term trend would turn bearish, that would indicate a pullback phase within the long-term uptrend, as we observed a number of times in 2024.
The key signal I’m looking for would be the medium-term trend turning bearish, which last occurred in September 2023. That signal would tell me to go more risk-off, to get more defensive, and to focus more on capital preservation than capital appreciation. For now, my Market Trend Model is suggesting a market trending higher. And until the medium-term trend turns bearish, I’m inclined to assume the market trend is innocent until proven guilty!
RR#6,
Dave
PS- Ready to upgrade your investment process? Check out my free behavioral investing course!
David Keller, CMT
President and Chief Strategist
Sierra Alpha Research LLC
Disclaimer: This blog is for educational purposes only and should not be construed as financial advice. The ideas and strategies should never be used without first assessing your own personal and financial situation, or without consulting a financial professional.
The author does not have a position in mentioned securities at the time of publication. Any opinions expressed herein are solely those of the author and do not in any way represent the views or opinions of any other person or entity.