DP Trading Room: Downside Exhaustion Climax
In this week’s edition of The DecisionPoint Trading Room, Carl begins by discussing the downside exhaustion climax that occurred on

In this week’s edition of The DecisionPoint Trading Room, Carl begins by discussing the downside exhaustion climax that occurred on

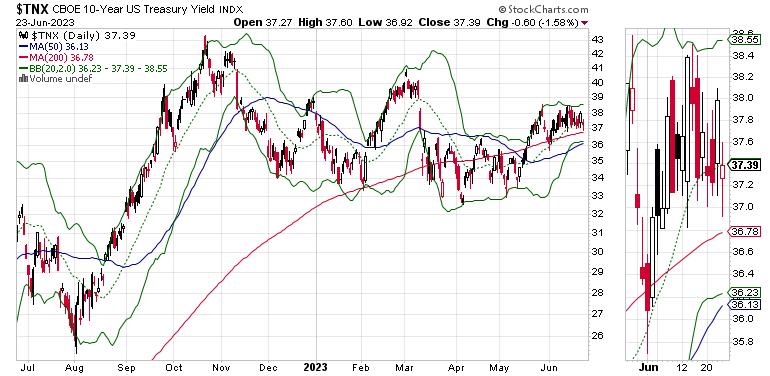
What we know for sure, is that the demand side of the U.S. Economy, as seen through the lens of

In this episode of StockCharts TV’s Sector Spotlight, I look ahead to the month of July and what we can expect
By the time this article hits the presses, there may be a fully developing civil war in Russia. Two weeks
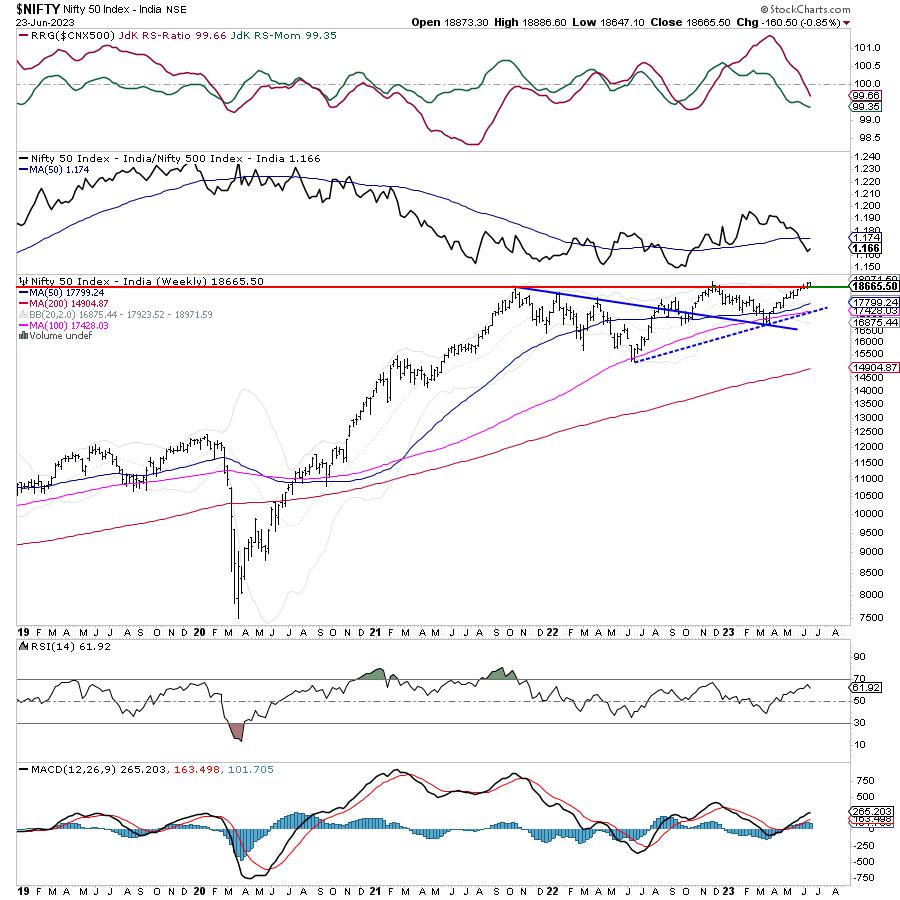
After a strong performance in the week before this one, the markets chose to take a breather. The NIFTY went
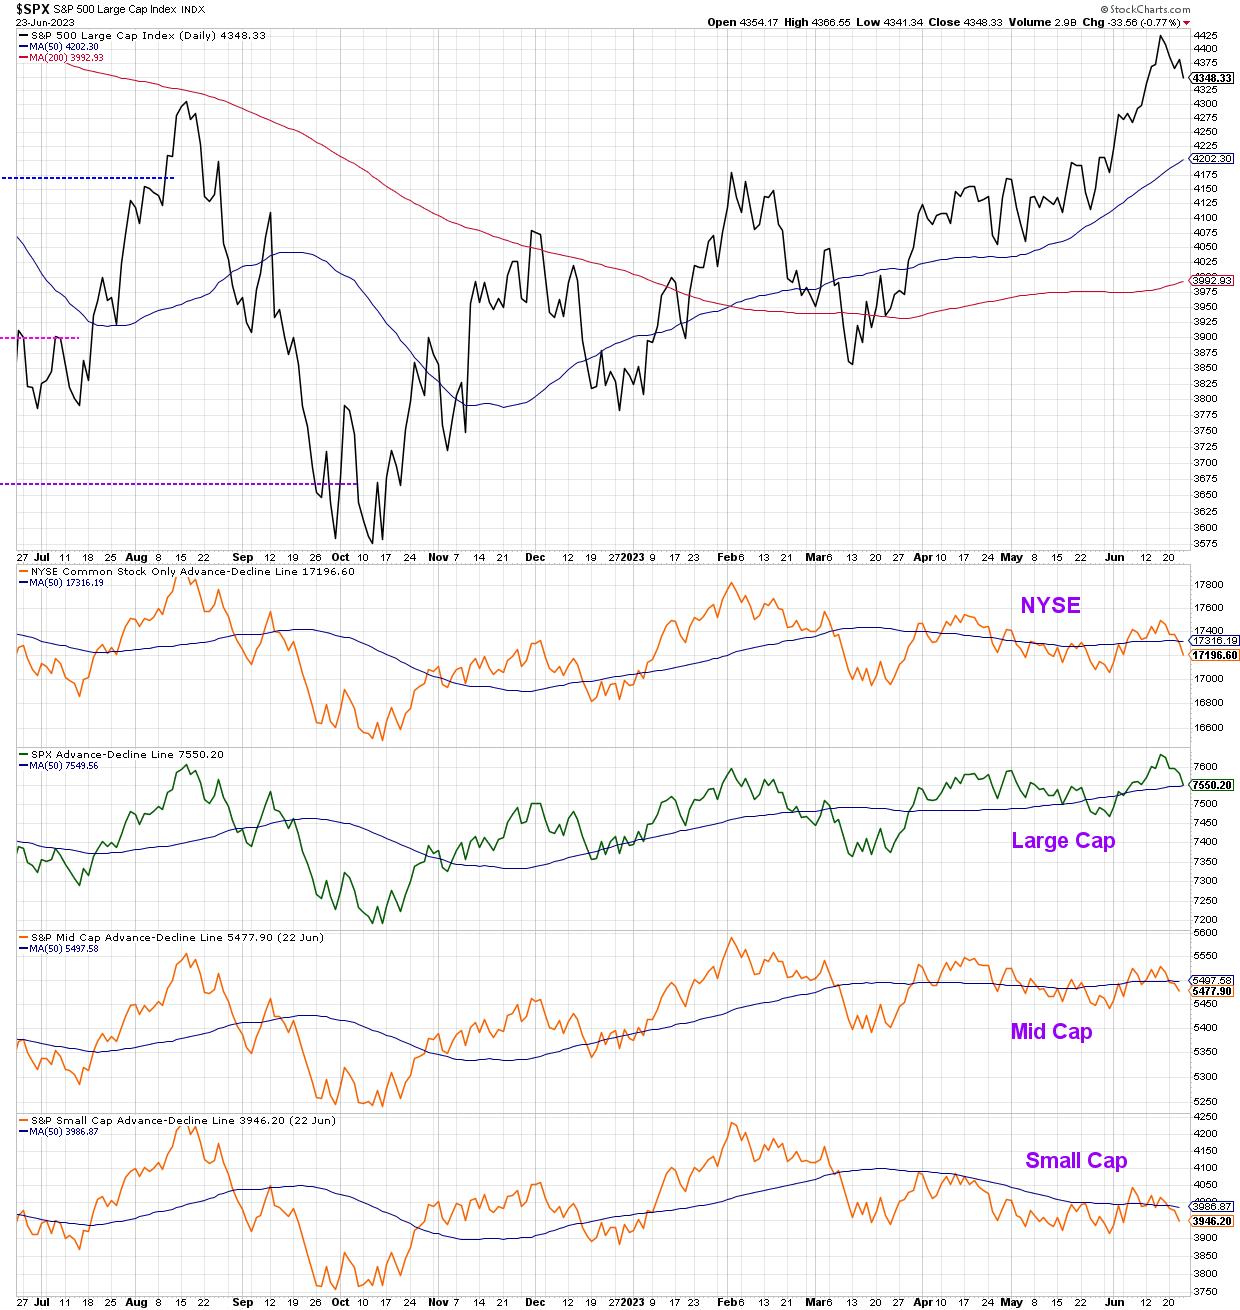
Recently, we’ve focused on the overextended nature of the small group of mega-cap leadership names in 2023, and even identified
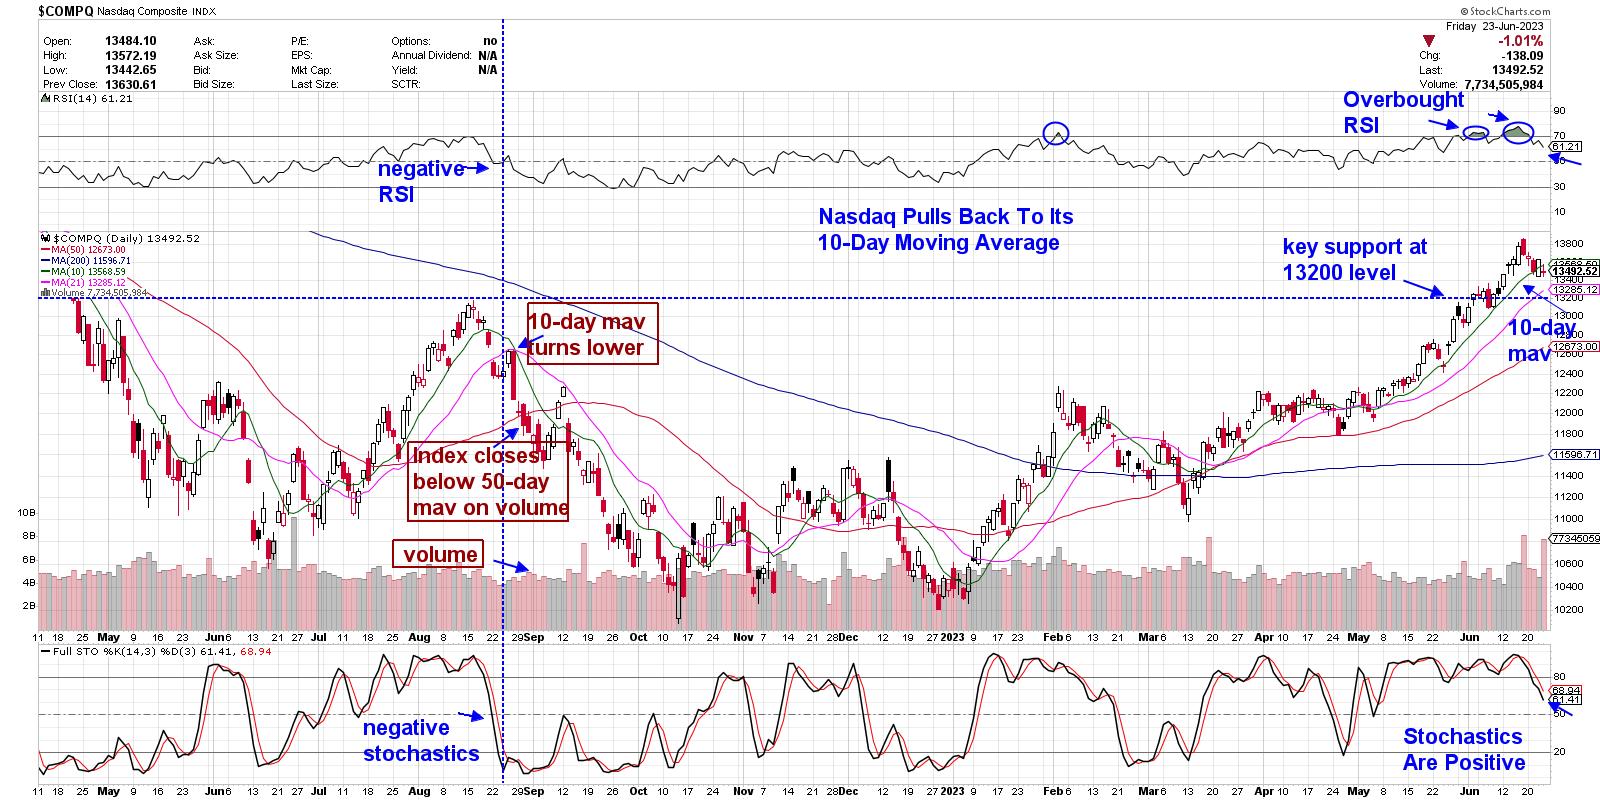
The markets pulled back this week amid global recession fears that followed the Bank of England’s interest rate hike. Most

In this episode of StockCharts TV‘s The MEM Edge, Mary Ellen shares important levels to watch as the markets pull back amid
2023 has seen a significant thrust in tech names. The recent run in semiconductor and software stocks are great examples

Once a month, I do a coaching session for our members of the Complete Trader, a MarketGauge comprehensive product for